How it works, screen by screen
Nine sections, one screenshot each. Every one is a capture of the running app on the demo project that is seeded into each account — a hospital wing with a looped cross main, a fire pump, a backflow preventer and a standpipe — solved.
Nothing below is a mockup, and no figure on any of these screens was typed into it. The pressures, flows, velocities and verdicts are the solver’s output for that project, and the caption under each figure says which solve produced them.
Draw the network
The Design view is a drawing surface with the solver behind it. Place a sprinkler, a junction or a demand point, draw pipe between them, and the network is laid out for you. Selecting things, dragging them, aligning and distributing them all work the way they do in a drawing tool, and every edit is one undoable change to the same document the sheets show.
Six overlays go on and off independently: flow arrows, node pressures, velocities, the governing path, the hose path and the loops. All six are on in the figure below, which is why every pipe carries its size, length and flow and every node its pressure.
No position on the drawing is computed by the page. The layout comes back from the same Rust crate that solves the network, and the PDF draws the figure from that same layout, so the schematic a reviewer holds is the schematic the designer arranged.
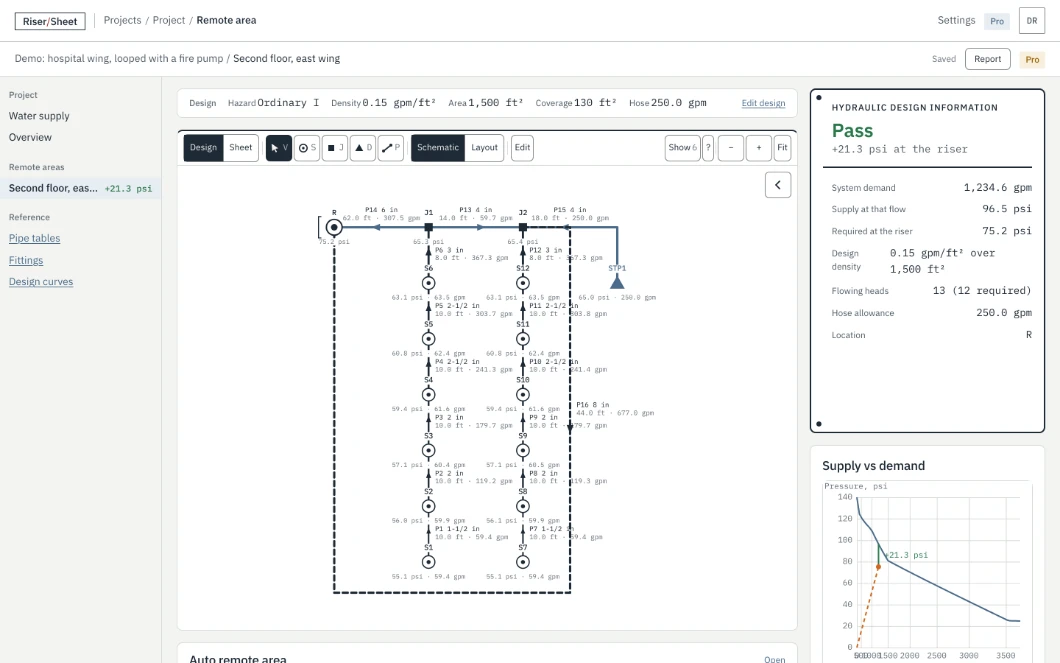
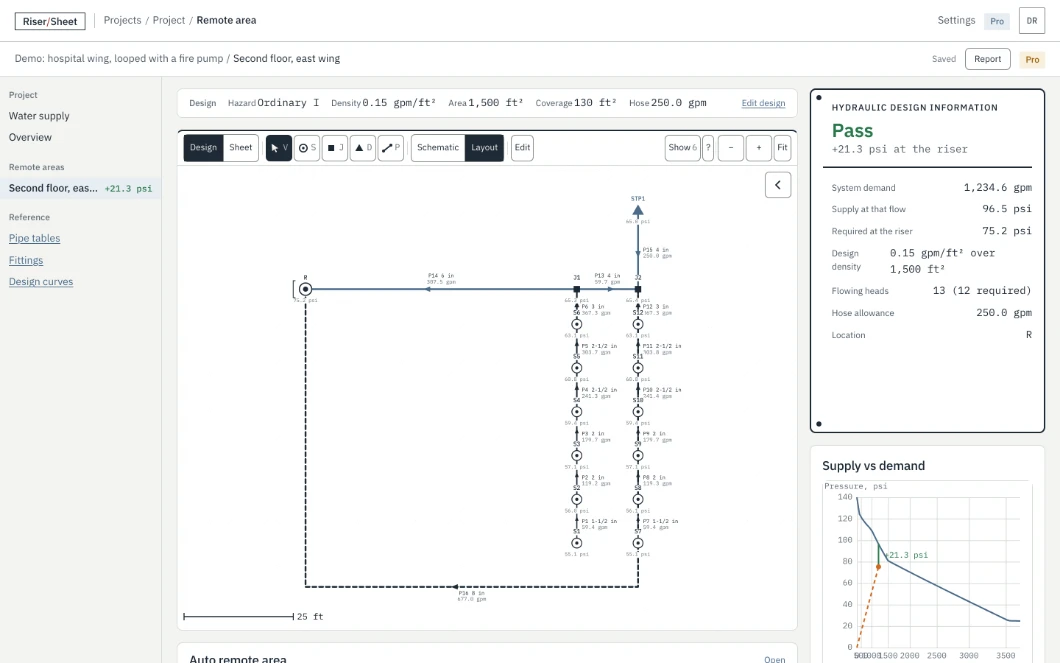
Layout mode is the same document to scale, with a scale bar to measure it against. A drag on its own never changes a length: the one place the drawing writes back to the sheet is “set lengths from drawing”, behind a button that names the pipes it will change and the values it will write.
Or type it as a sheet
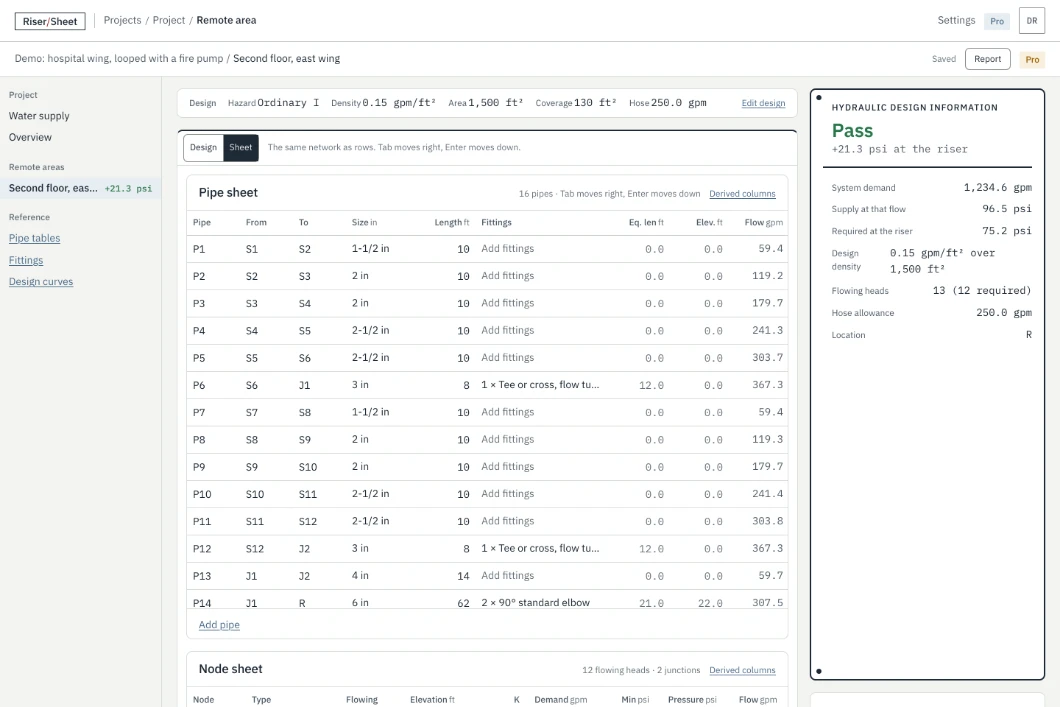
A designer already thinks in rows of pipes, so the drawing has a second face. Tab and Enter move like a spreadsheet, paste from Excel fills the input columns, and adding a row whose end node does not exist creates the node. The pipe sheet and the node sheet are the same document as the drawing, one segmented control apart.
The columns on the left were typed. Equivalent length, elevation and flow were not — they are read-only output, set in the mono face so the numbers line up down the column and so it is obvious at a glance which half of the sheet is yours.
It re-solves as you type
There is no calculate button. The whole remote area re-solves inside one animation frame after every keystroke, and the nameplate at the right changes with it. The solver is one Rust crate compiled to WebAssembly, so the arithmetic happens in the browser without a round trip, and it is the same crate the server links natively when it builds the report.
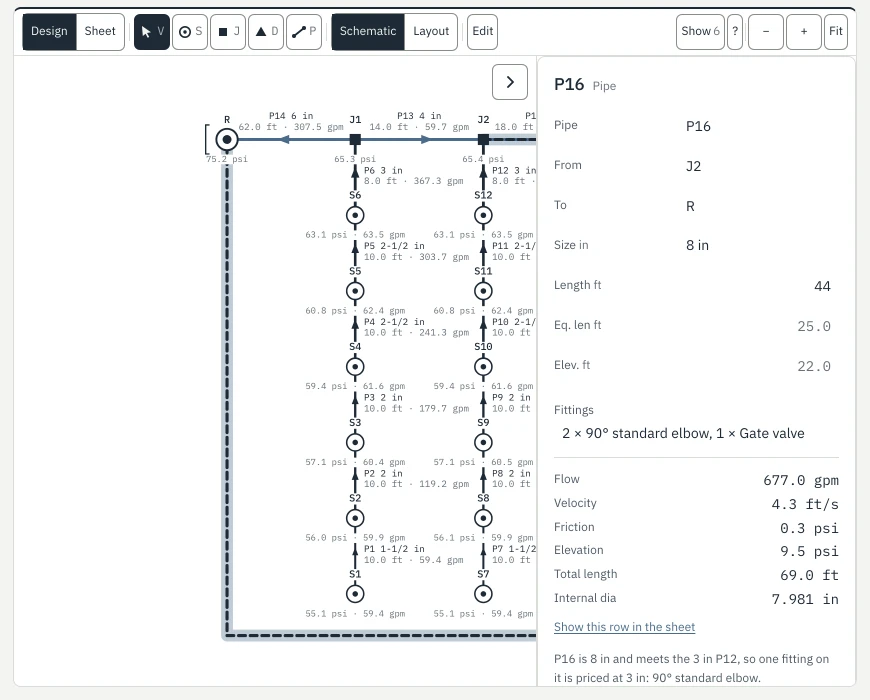
Select a pipe or a node and the inspector reads out that row of the sheet standing on end: what you entered above the rule, what was solved below it. The link at its foot goes to the row itself, because the drawing and the sheet are the same document and a number you want to change is always in one place.
Know the margin
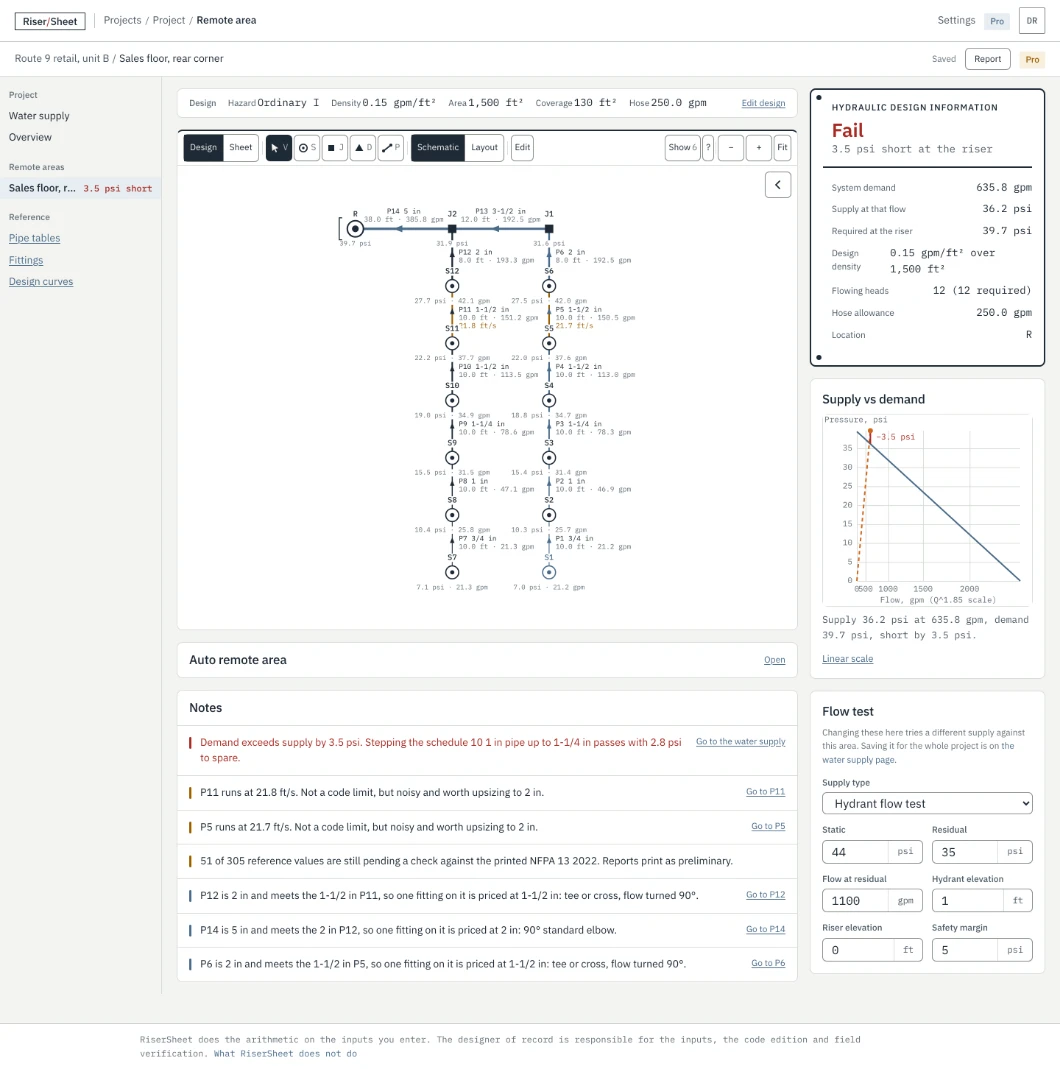
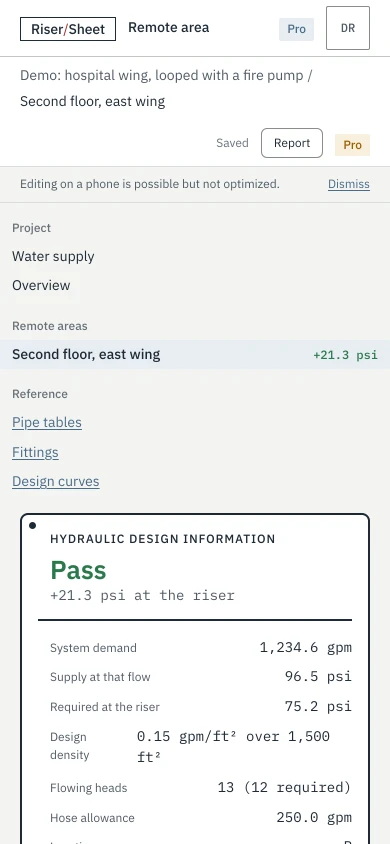
The nameplate is the stamped plate an NFPA 13 submittal carries, and it says one of two words. Pass or Fail, and by how many psi at the riser, over the demand, the supply at that flow, and what the system needs. The graph beside it puts the demand point on the supply curve so the margin is a distance rather than a claim.
When it fails, the notes list says what would fix it. The suggested fix is a second solve, not a rule of thumb: the solver tries a change, reports the one that passes, and states the margin that change leaves. Advisory notes say so in as many words, so a velocity warning is never mistaken for a code limit.
One supply, every area
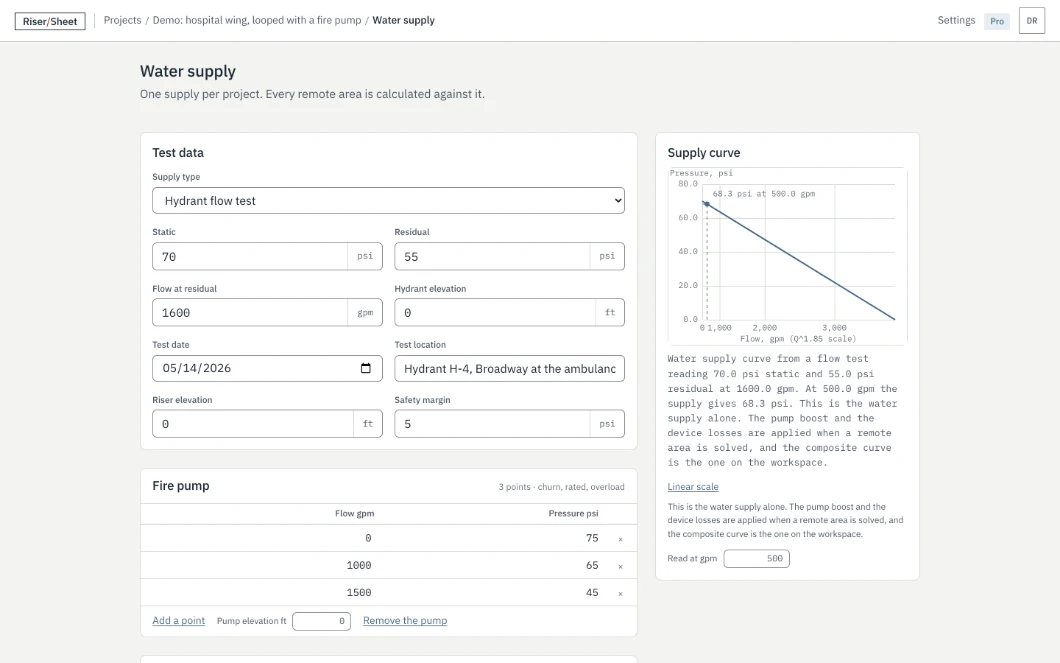
A project has one water supply and every remote area in it is calculated against that supply. Enter a hydrant flow test or a tank, and the curve is plotted on the flow-to-the-1.85 scale a plan reviewer expects, readable at any flow. Change the flow test and every area in the project can be re-run against the new one.
A fire pump is a table of curve points, and a backflow preventer or a meter is a table of losses from the manufacturer’s curve. Both are applied when an area is solved, and the composite curve is the one the workspace shows.
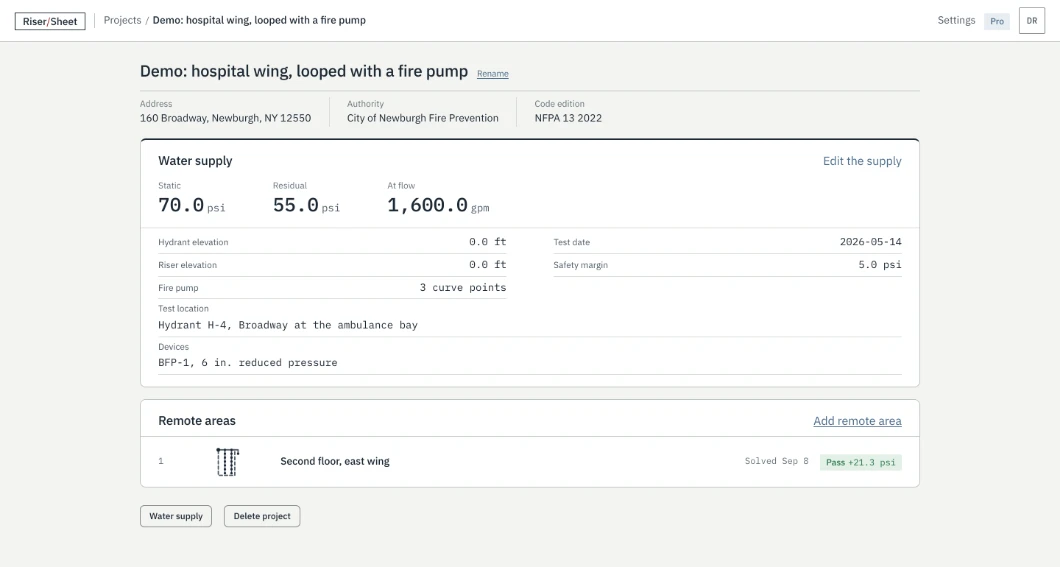
The project overview leads with that supply, then lists every remote area with the date it was last solved and the margin it solved to. Above them sits the project’s title block — address, authority having jurisdiction, code edition — which is what the corner of a shop drawing says and what the report cover repeats.
Loops, pumps, standpipes and antifreeze
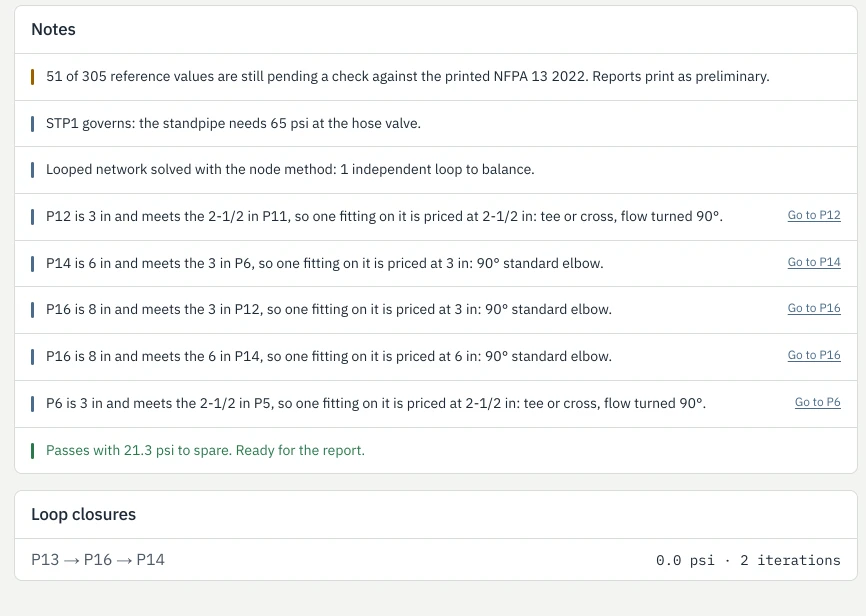
A tree system solves by working back from the remote head. A loop or a grid does not, so the Pro plan solves those by the node method and reports what it did: which pipes closed the loop, the imbalance it closed to, and how many iterations it took. A standpipe outlet takes its own demand at its own pressure, and it says so when it governs.
Antifreeze runs on Darcy-Weisbach rather than Hazen-Williams, because a glycol solution is not water and the Hazen-Williams C-factor has nowhere to put viscosity. Automatic remote area selection, multiple hose demands, and the firm logo and NICET number on the report are Pro as well.
Hand over the report
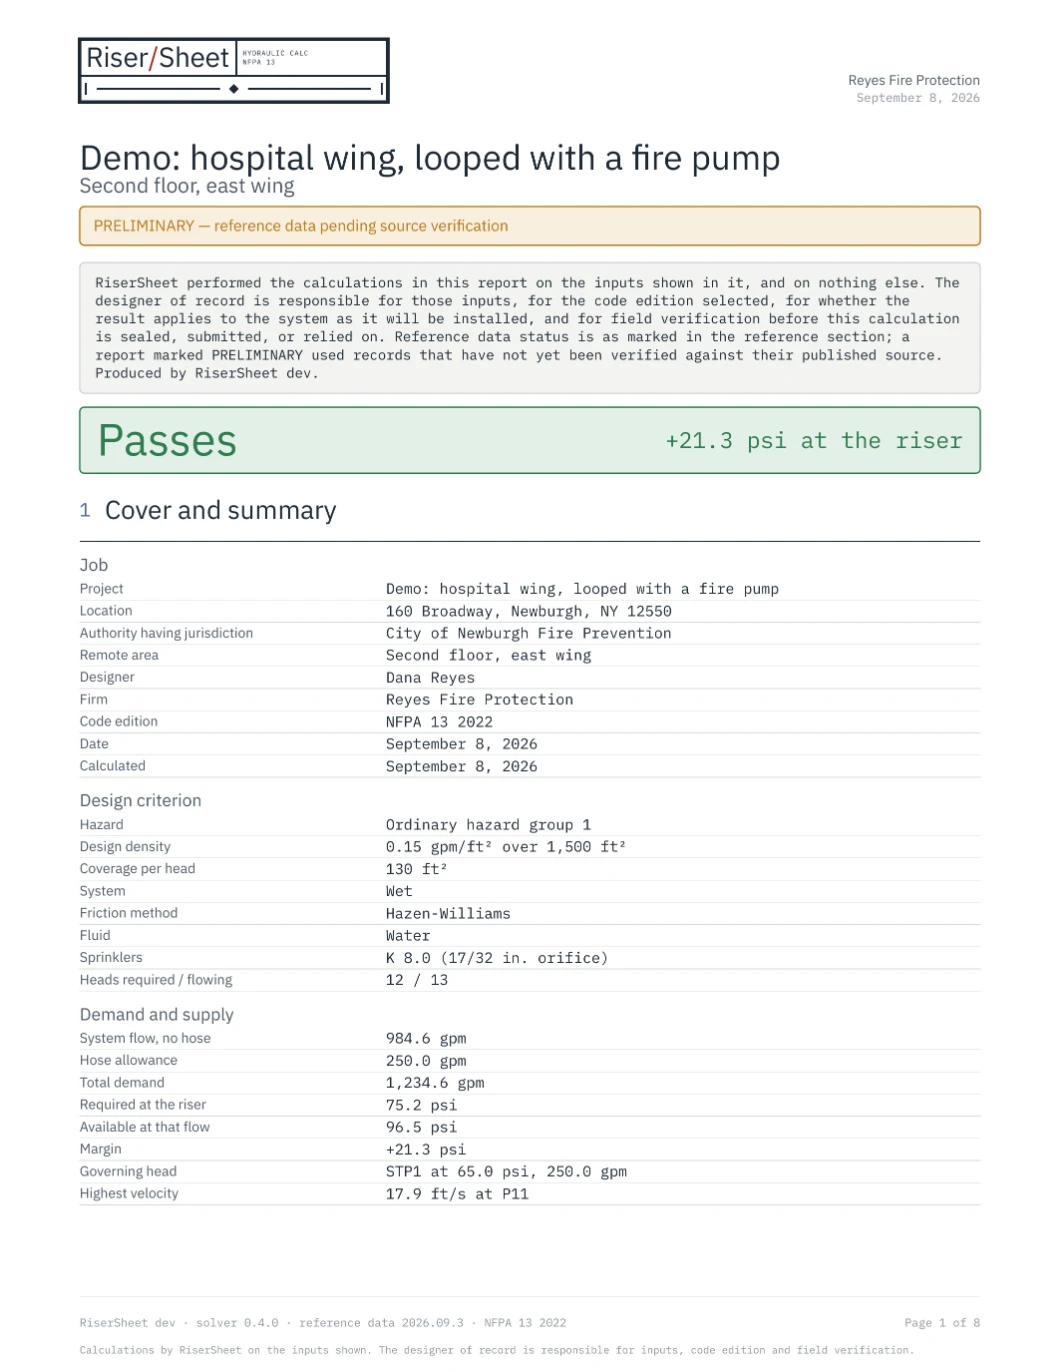
When an area passes, the report is eight sections: the cover and summary, the water supply with its curve, the node data, the pipe data, the network schematic, the supply and demand graph, the pipe and fitting quantities, and the notes and assumptions with the designer statement. The browser previews every sheet before the PDF is built.
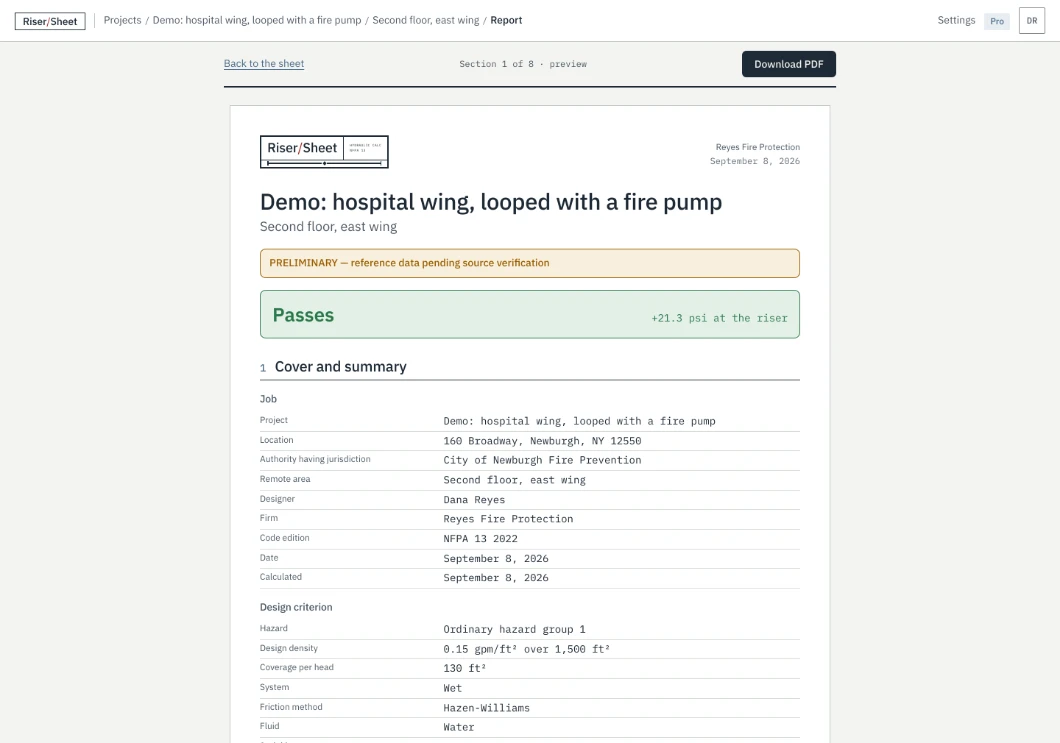
The PDF is stored with the inputs it was built from, so a report you sent last month still says what it said. Its footer carries the solver version, the reference-data version and the code edition, which is what makes a calculation re-checkable rather than merely printable.
The banner on both is worth reading rather than glossing over. Some records in the reference tables have not yet been checked against their published source, and until they are, every report prints marked preliminary. That is the product refusing to let a PDF look more finished than the data behind it.
Reviewers and roles
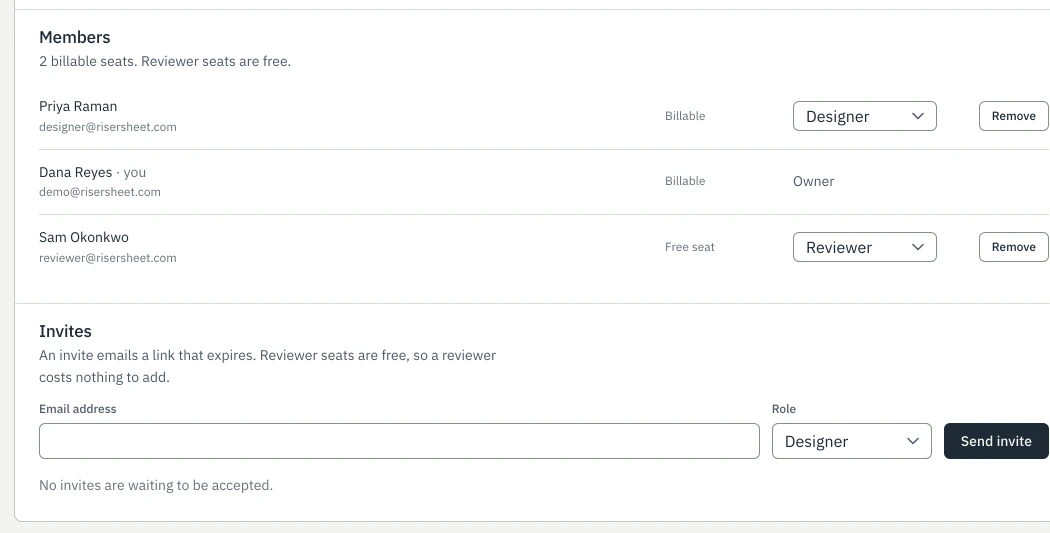
Three roles. An owner runs the organisation and its billing, a designer does the work, and a reviewer reads. Reviewer seats are free and unlimited, because the person approving a calculation is the second user of it and charging for that would mean two people sharing one login.
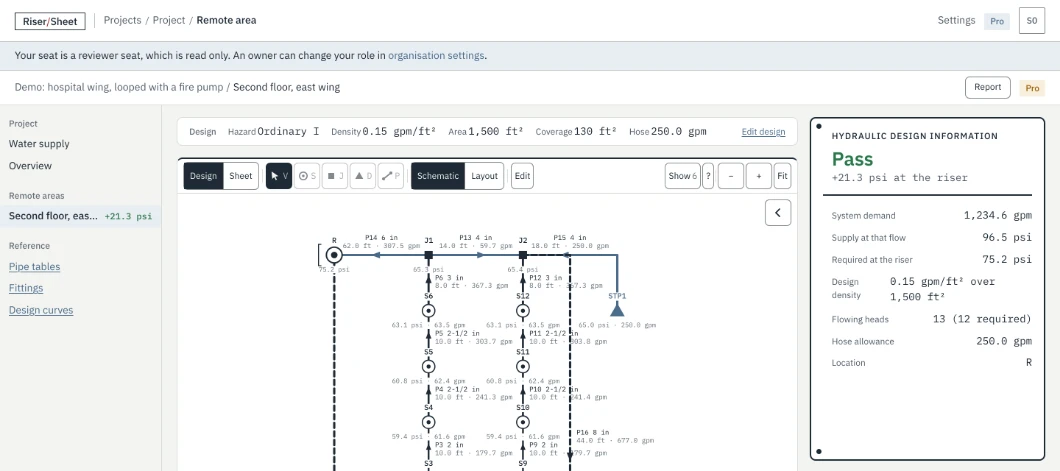
A reviewer sees the same drawing, the same sheets and the same report, and the tools that would change them go quiet. Nothing is hidden from them: read-only here means the edits are refused, not that the calculation is.
Try it before you sign up
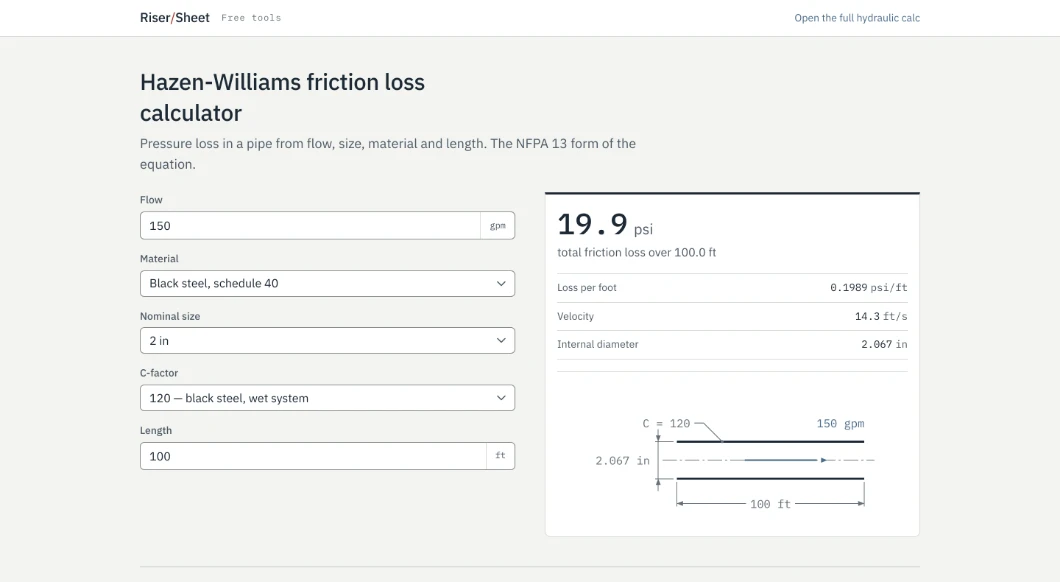
Six calculators run the same WebAssembly module as the app, with no account and no email capture, so the answer on those pages is the answer inside the product. They are the honest way to check the arithmetic against a hand calculation before trusting it with a submittal.
- Hazen-Williams friction loss
- Sprinkler K-factor discharge
- Water supply curve
- Pipe velocity
- Elevation pressure
- Fitting equivalent length
On a phone the workspace keeps the drawing, the verdict and the camera, and drops the tools a phone cannot drive. Editing a sheet of pipe data needs a keyboard, and pretending otherwise would cost a designer a mistyped length rather than save them a trip to a desk.
Know the margin.
The trial runs 14 days with every feature and no card. You land in the finished sample project, so the first calculation you read is a completed one, and the demo projects this page is drawn from are in the account with it.
What it does not do
The drawing half of a CAD package. There is no DXF import, no head spacing, no sheet set and no plotting. The Design view draws the network you calculated; it is not the drawing you submit. The designer of record stays responsible for the inputs, the adopted code edition and field verification.